
Case Study: How One Investor Used a Calculator to Pick the Right Market
Alex stares at two Zillow listings on his laptop screen. It is 11:30 PM on a Tuesday. His coffee is cold.
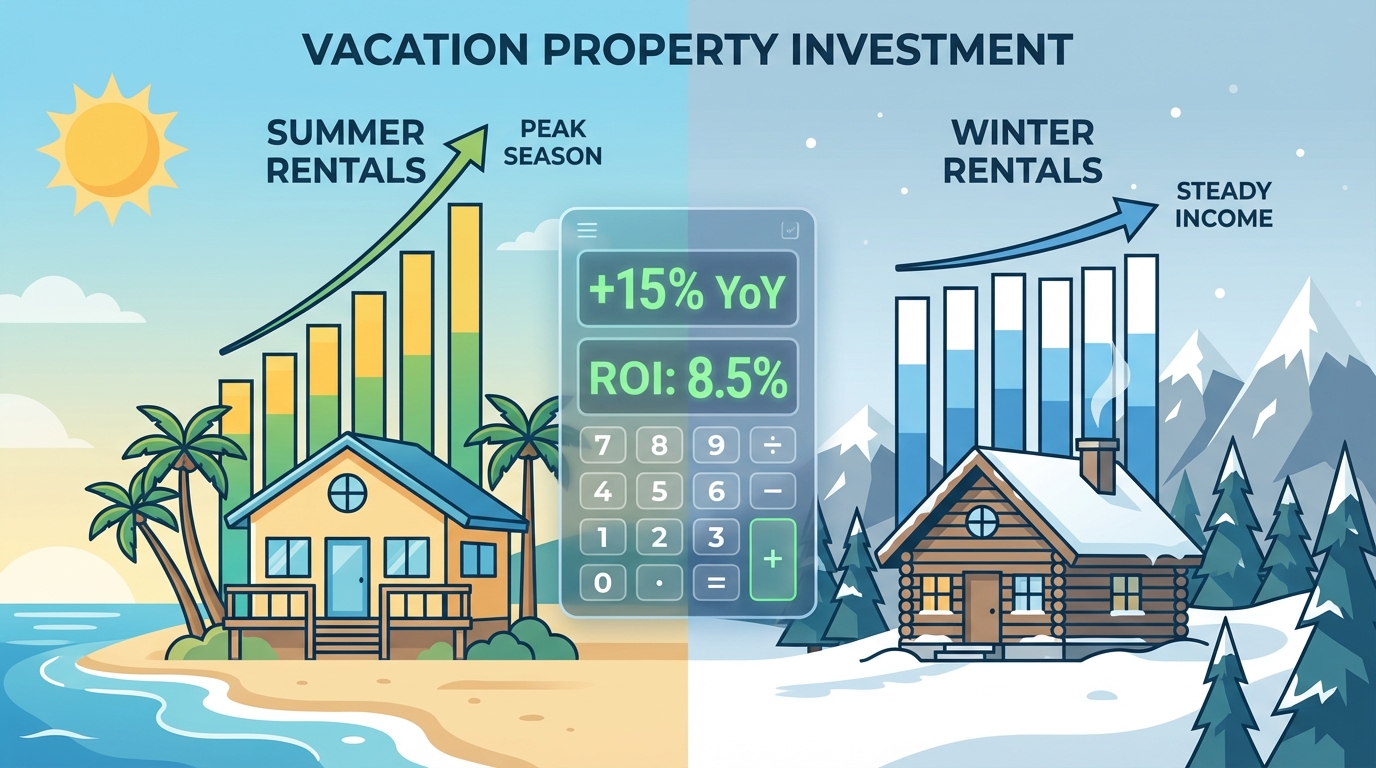
Alex stares at two Zillow listings on his laptop screen. It is 11:30 PM on a Tuesday. His coffee is cold.
He has $200,000 in savings. He wants to become a real estate investor. But right now, he feels like a gambler at a roulette table.
On the left side of his screen sits the Beach House. It costs $1.1 million. It promises massive summer income but sits empty during the winter. On the right side sits the Mountain Cabin. It costs $1.02 million. It offers a steady flow of skiers and hikers, but the nightly rates are lower.
He likes the idea of the beach. He feels safer with the mountain.
This is “Choice Paralysis.” It kills more deals than high interest rates. Alex is stuck guessing which property builds wealth faster. He compares photos of kitchens instead of comparing the velocity of his money.
He needs to stop guessing. He needs to move from emotional selection to mathematical certainty.
Step 1: Replacing Assumptions with Data
Spreadsheets are dangerous. They are static. You make a typo in cell C4, and suddenly you think you are a millionaire. A few months later, you realize you are broke.
Alex decides to use a professional tool. He logs into Rental Forecast®.
This software does not care about granite countertops. It cares about data. It serves as the pivot point in his decision-making process. It replaces his gut feelings with predictive analytics.
Alex inputs the hard numbers to set the stage:
- Purchase Prices: $1,100,000 for the Beach House versus $1,020,000 for the Mountain Cabin.
- Down Payment: He enters 20%. This is the industry standard for investment properties.
- Loan Type: Alex is not using a traditional mortgage. He plans to use a DSCR loan.
This is a crucial distinction. Through Strategic Investment Financing & Advisory, Alex learns that he can qualify based on the property’s income, not his personal tax returns. The tool allows him to model this specific loan type to see how the debt service impacts his cash flow.
Step 2: The “Unsexy” Truth About Expenses
Novice investors obsess over Top Line Revenue. They see “$100,000 a year” and start shopping for boats.
Experienced investors look at Net Operating Income (NOI).
There is a massive gap between what a house earns and what a house keeps. Operating costs for a profitable investment typically eat up 25% to 45% of total revenue. If you ignore this, you fail.
Alex uses the calculator to account for every dollar that leaves his bank account. He inputs the following expense breakdown:
- Property Management: 20% of revenue. He knows he cannot manage a short-term rental while working his day job. He will use the Rental Property App Directory to find a reliable team.
- Maintenance: 5% of revenue. Things break. Budgeting for it turns an emergency into a line item.
- Utilities & Insurance: He estimates $14,000 per year for the coastal property due to higher wind insurance premiums.
For a deeper dive on why these numbers matter, read How to Calculate Short-Term Rental Expenses. This breakdown prevents the rude awakening that hits most beginners in their first year.
Step 3: The Financial Showdown (The Results)
Alex hits “Calculate.”
The tool generates the results. This acts as the definitive artifact. It ends the debate. The numbers tell a story that his emotions could not see.
Metric A: Cash-on-Cash Return (CoC)
This metric tells Alex how hard his $200,000 down payment works for him.
- The Beach House: Delivers a 22% Cash-on-Cash return.
- The Mountain Cabin: Delivers a 19% Cash-on-Cash return.
Both numbers are impressive. According to data from Touch Stay, typical ROI benchmarks in 2026 hover between 4.5% and 7%.
Both properties outperform the average market. However, the Beach House generates significantly more cash relative to the money Alex puts in. It wins this round.
Metric B: DSCR (Safety)
Profit is good. Safety is better.
DSCR stands for Debt Service Coverage Ratio. It is the banker’s safety score. It measures if the property generates enough income to pay the mortgage.
A ratio of 1.00 means you break even. Banks want to see a ratio of 1.25 or higher. To understand why this 1.25 figure is the magic number for lenders, review this Airbnb Loan Case Study by Ridge Street Capital.
- The Beach House: Scores a 1.45 DSCR. This is very safe.
- The Mountain Cabin: Scores a 1.32 DSCR. This is safe, but tighter.
The Beach House generates $1.45 for every $1.00 of debt. The bank views this asset as low risk. This means Alex can likely negotiate better terms or secure funding faster for his next purchase.
Step 4: The Wealth Accelerator (Tax Strategy)
There is one more layer to this case study. It is the hidden profit center most people miss: Taxes.
The calculator reveals that the Beach House allows for a more aggressive tax strategy.
Alex plans to use Cost Segregation. This strategy accelerates the depreciation of the property. Instead of writing the house off over 39 years, he writes off parts of it, like carpeting and fencing, in the first year.
This can result in a massive tax deduction. A Cost Segregation Case Study by CSSI Services shows how investors can legally wipe out thousands of dollars in taxable income immediately.
For the Beach House, Alex projects a $25,000 tax savings in Year 1. This is real cash that stays in his pocket.
To execute this STR strategy, Alex must set up the correct legal entity. He needs Asset Protection & LLC Formation services to ensure his business structure supports these deductions. You can learn more about these methods in our guide on Tax Strategies for STR Owners & Investors.
The Verdict: Why The Beach House Won
The decision is no longer about which kitchen looks nicer. It is about Capital Efficiency.
Alex chooses the Beach House. He makes a successful purchase based on three factors:
- Higher CoC: 22% beats 19%. His money grows faster.
- Stronger Safety Margin: A 1.45 DSCR makes him a favorite client for lenders. It secures the asset against market dips.
- Immediate Liquidity: The combination of high cash flow and tax savings creates a “war chest” of over $40,000 in the first year alone.
This liquidity allows him to buy his second property sooner. The Mountain Cabin was a good house. The Beach House is a scalable business.
Conclusion: The Agent’s Role
The tool did not just pick a house. It built a business plan.
Alex walked into his lender’s office with a white-labeled report from Rental Forecast®. He did not have to convince the bank he was smart. The paper proved the numbers worked.
Real estate agents who use Rental Forecast® do not just sell homes. They sell clarity. They generate these reports to eliminate hesitation. They turn nervous clients into confident investors.
When you replace guessing with data, the right choice becomes obvious.
Not sure which strategy fits?
Take the investor quiz and get pointed toward the rental strategy that matches your goals — then talk it through with a KW agent who invests for a living.